thesctrading
Presentation Link
Thanks for a great semester - see our presentation at the link here: ‘https://drive.google.com/file/d/1KaIhFYo5EsIE-d401vH0emGVLBg_9wR2/view?usp=sharing’
S&C Trading Strategy Overview
1. Strategy Outline
Our team is implementing a buy low / sell high strategy focused on short-term momentum trading in TSLA stock. We aim to take advantage of periods of elevated volatility and momentum. We use implied volatility from options data to inform our volatility expectation and therefore our limit sell (or buy in the case of a short). We also use probabilities from a logistic regression based on alternative and technical to size our trades, a key differentiation to our HW1 model. Our model also has more thoughtful entry parameters and trades more selectively based on underlying conditions in the stock. We walk through our model and an example trade below.
2. Example Trade Walkthrough
Pre-Trade Filter
- Check if job postings for software roles increased week-over-week (as well as other FRED/alternative data including pairs performance)
- Check if implied volatility (IV) percentile > 40% and < 90%
- If both are true → proceed to trade evaluation and if price > last weeks close, short the stock and vice versa
Position Sizing
We run a logistic regression on the success of our historical trades with IV, SMA, and WAP as features to determine how to size our new positions. Given our limited dataset, this is only evident in a few of our trades (as a result of our fairly strict pre-trade criteria), but allows us to manage risk under various momentum regimes, taking discretionary risk in favorabe market conditions and conserving capital in those which are unfavorable.
Exit Strategy
We use two exit triggers to manage risk and lock in profits:
- If position is open for more than 5 trading days (one week), exit regardless of performance
- If position hits limit price (determined by options implied volatility expectations for the week), sell
note that compared to the basic HW1 empirical volatility model, we forecasted vol using the options implied volatility. We converted the first IV datapoint of a trade period (ie. Monday’s open) to an expectation of weekly vol and used this vol to calculate our limit buy and sells. We thought this was more descriptive and informative of market expectations for upcoming vol. We also used IV in our pre-trade checklist in order to ensure we are taking risk at the right times. We considered using ML to determine more effective pre-trade requirements which were less binary, but did not implement these. Using the IV is much better at being forward-looking as opposed to the previous backward looking volatility analysis. This helps us build a more informed, sensible, and risk-aware model.
3. Data Requirements
Data from the following sources was used to inform our trades:
- Price data and technical indicators (SMA, WAP, IV)
- Job posting data & other relevant metrics from FRED
- Implied volatility percentile data (via IBKR)
4. Commentary & Reflection
There were a few features we had hoped to include in our model which proved unsuccessful or were too cumbersome to implement. One such feature was determining which direction (long or short) to trade based on whether the price was above the 50-day SMA as opposed to the prior period’s close did not work as well as we had hoped from a returns perspective. We thought it would be a smoother metric than previous trade period close. However, after testing the strategy using SMA for several period lengths (20, 30, etc.), we found that the results were worse. We also found that using implied volatility was much more effective and that sizing positions continuously through the logistic regression was very effective relative to the standard model. We can infer that this makes our model more well informed and therefore more effective. With more time, we would’ve implemented more fundamental metrics to help inform our trading plan (historical average EV/EBITDA and other valuation metrics).
5. FRED Data: Software Developer Job Postings
The below is demonstrating our ability to use the FRED API to pull in features. This example is weekly software job postings which we use as a pre-trade filter in our model.
Blotter & Ledger
success
0    44
1     7
Name: count, dtype: int64
Blotter & Ledger Results
Blotter
| entry_timestamp | qty | exit_timestamp | entry_price | exit_price | success | iv | wap | sma | prediction | prediction % | |
|---|---|---|---|---|---|---|---|---|---|---|---|
| Loading ITables v2.3.0 from the internet... (need help?) |
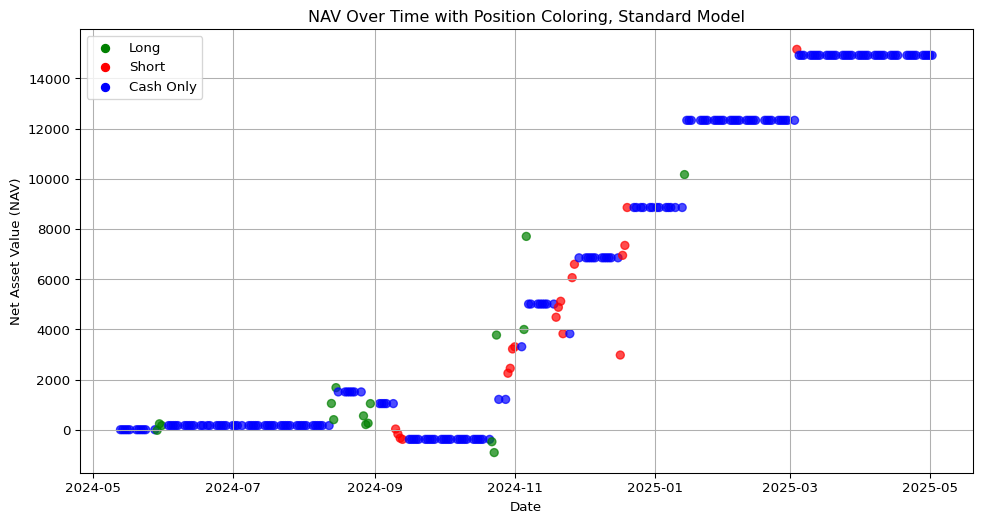
Standard Ledger
| date | position | cash | mark | mkt_value | |
|---|---|---|---|---|---|
| Loading ITables v2.3.0 from the internet... (need help?) |
NAV Results With Constant Quantity
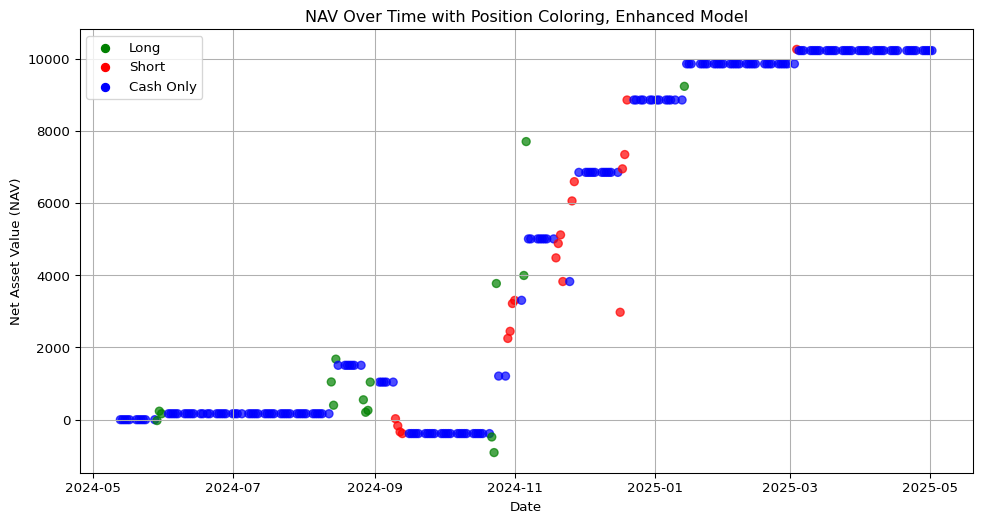
Enhanced Ledger (continuous position sizing)
| date | position | cash | mark | mkt_value | position_category | |
|---|---|---|---|---|---|---|
| Loading ITables v2.3.0 from the internet... (need help?) |
NAV Results With Smart Quantity
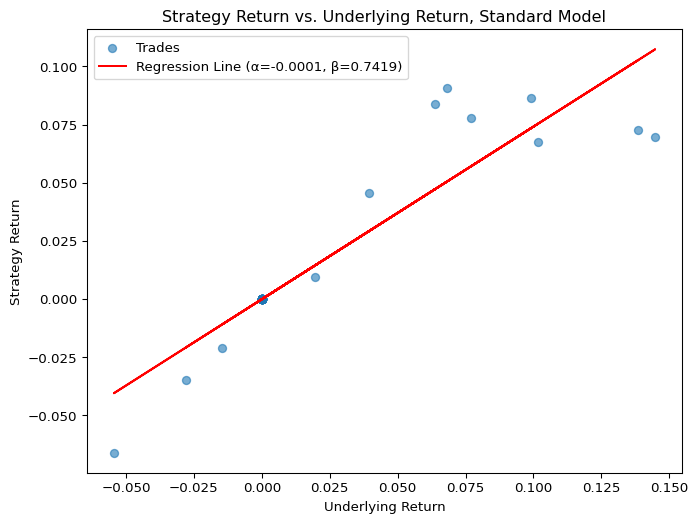
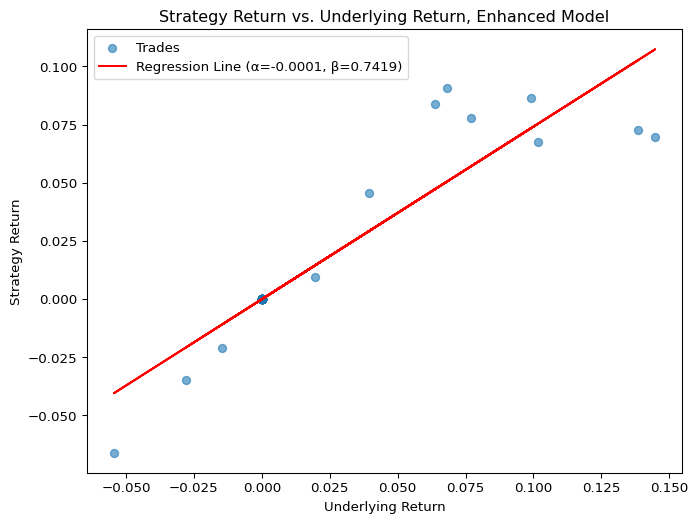
Performance Statistics
At a high level, we compute: - Alpha & Beta (vs SPX benchmark) - Annualized Volatility of strategy returns - Geometric Mean Rate of Return (annualized) - Sharpe Ratio (assuming zero risk‐free rate) - Average return per trade - Average number of trades per year
| Value | |
|---|---|
| Loading ITables v2.3.0 from the internet... (need help?) |